
This post was originally published on this site.

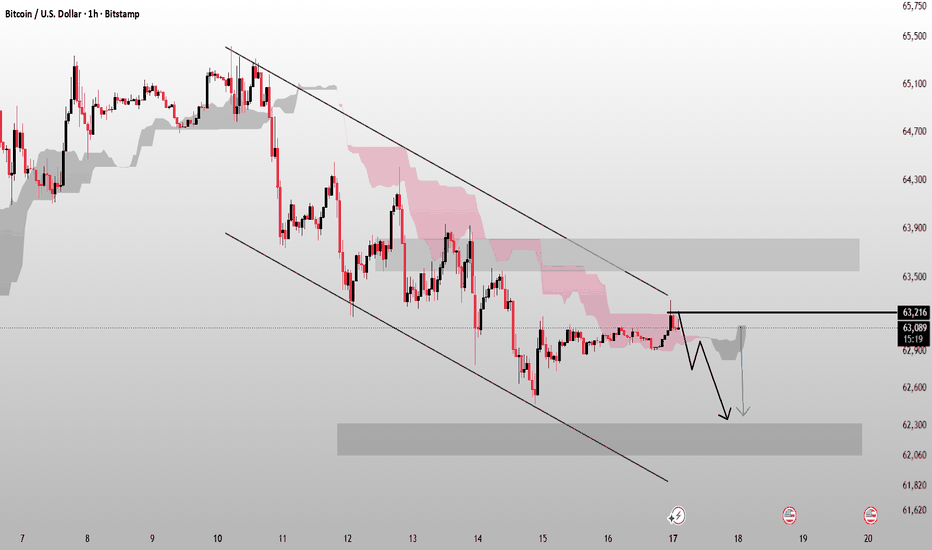
BTCUSD 1H — Descending Structure & Key Zones
BTCUSD is showing a clear descending structure on the 1H chart, with price continuing to trade below the main falling trendline.
The current price area around 63,200–63,250 is an important short-term level. Price is testing this zone while the Ichimoku structure remains a key reference for the next move.
🔹 Upper zone: 63,500–63,850
This area has acted as a major reaction region and may become important if price moves above the current structure.
🔹 Current level: 63,200–63,250
A key area to watch for a reaction or a change in short-term structure.
🔹 Lower zone: 62,050–62,300
This is the main highlighted support area on the chart.
The projected path shows the possibility of a move lower from the current region toward the 62,300 area, but confirmation from price action would be important rather than assuming the projection will play out.
For me, the main idea is simple: watch the reaction around 63,200–63,250 and the behavior of price relative to the descending structure.
📌 This is a chart-based technical view for educational purposes. Market conditions can change quickly, so levels should be reassessed as new candles develop.


